I live in Phoenix and they like to say “it’s a dry heat” when it is 117F (47C). However, less is said during the monsoon season (officially Jun 15 – Sep 30), when it might only be get to 105F but with high humidity. As I write this, it is 104F with a 30% relative humidity. According to the National Oceanic and Atmospheric Administration (NOAA), that is dangerous. Why? Because humans use evaporative cooling (sweat) to cool, and sweating becomes less efficient as the humidity climbs. Rather than being just a discomfort, it is predicted that climate change may make some parts of the world unliveable: [Beyond human endurance](https://www.washingtonpost.com/world/interactive/2021/climate-change- humidity/) and The emergence of heat and humidity too severe for human tolerance.
The NOAA provides a Heat Index “… a measure of how hot it really feels when [relative humidity](https://w1.weather.gov/glossary/index.php? letter=r) is factored in with the actual air temperature.” To get a better idea of my circumstances, I reused the hardware/software samples provided by Toit of temperature and humidity measurement, communicating between devices via the cloud and using a small TFT display over SPI, to build two devices.
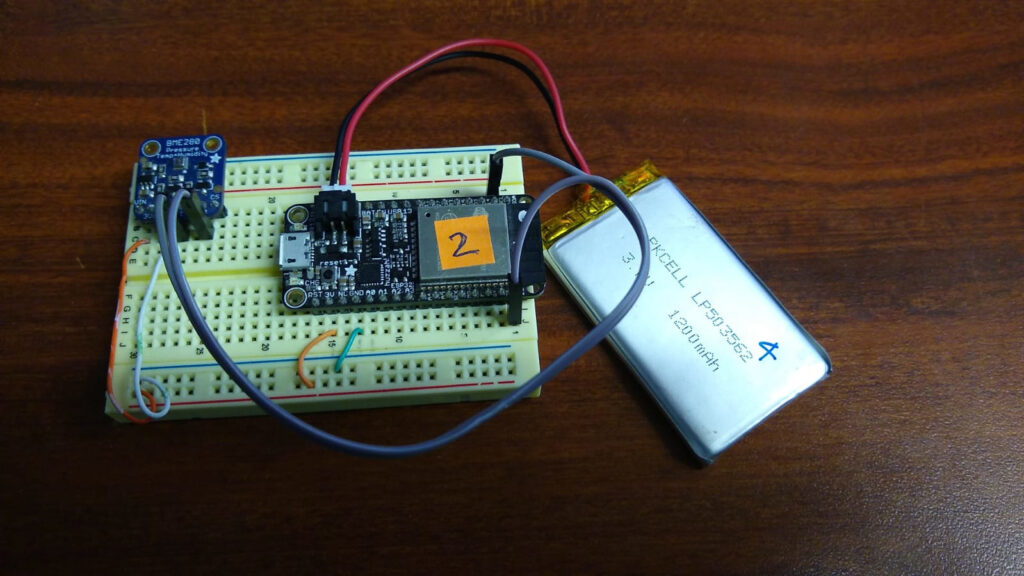
The first device, placed outside my office under an awning, was made using an Adafruit HUZZAH32 communicating over I2C to a BME280 module temperature/humidity sensor. The HUZZAH board has the advantage that it supports LiPo batteries, enabling easy placement without regard to a USB power cable. The publisher.yaml file was configured with a CRON job to run every 15 minutes to measure and report data, sleeping the remainder of the time to conserve battery. The device was configured in the console (Devices/02/Configuration/Max offline) to only come online every 15 minutes, since radio power consumption dwarfs other device power expenditure. The heat index is calculated from temperature and humidity via a formula provided by the National Weather Service (NWS) and the severity of that is found in a (extended) table lookup, again from NWS. A JSON data package is encoded and published to a cloud topic cloud:heat_index , for consumption by the second device.
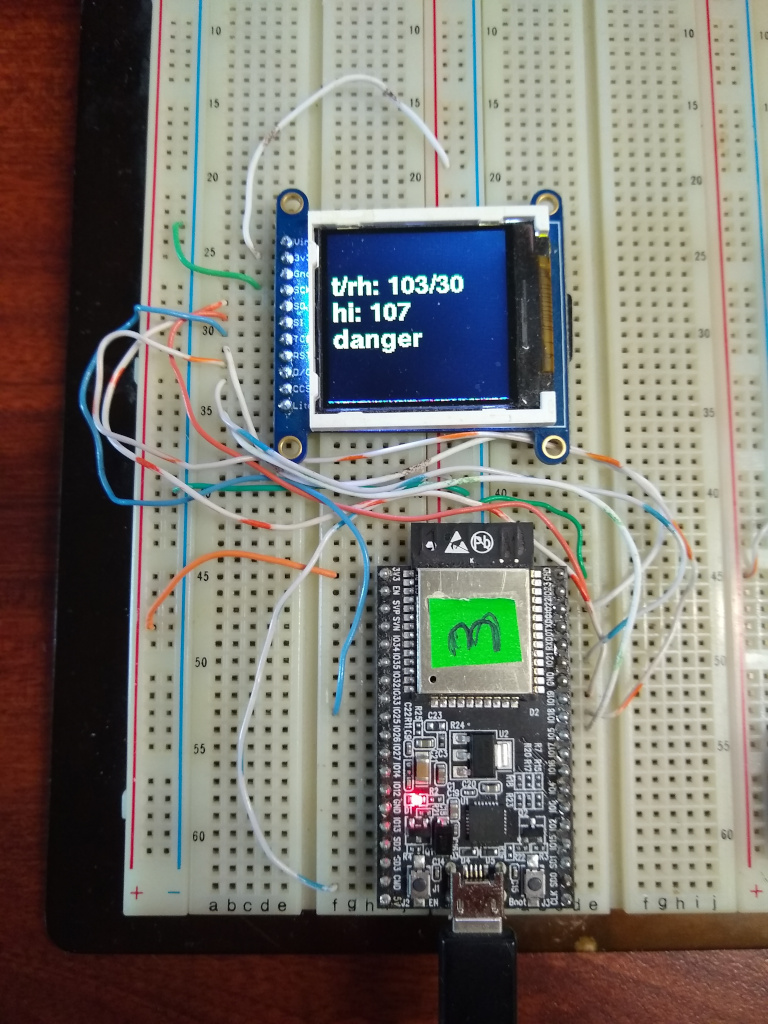
The second device was built with older parts I had, an ESP32_Core_board_V2 (the ESP32 Saola is the more current part) communicating with an Adafruit 128×128 TFT color display over SPI. The
display is not covered in the aforementioned Toit sample code, so the wiring noted in the
README.md and simple revisions to the driver are mine, caveat emptor. (there is visible jank on the
bottom row of the display). The second device subscribes to the topic cloud:heat_index and
displays the outside temperature, humidity, calculated heat index and textual warning, as shown,
from the comfort of my office.
The code for the publisher and subscriber devices is posted on GitHub. The publisher was
less than 60 lines of code, with another 90 for the heat index calculation, half of which was the heat
index rating static declaration. The subscriber was less than 50 lines. The Toit CLI allowed me to
subscribe to the PubSub messages via toit pubsub read cloud:heat_index heat_index
to monitor message flow. The console logs provided stack traces when my device code failed and
the OTA (over-the-air) device update facility allowed me to re-program the outside publisher device
over WiFi, without leaving the comfort of my office (a significant advantage over CircuitPython).
It was a quick experiment on separately measuring and reporting the Heat Index via WiFi, to a dedicated, inexpensive display device. And yes, in Phoenix, sometimes it is not a dry heat.